on
Horizontal pod auto-scaling, custom metrics and time-scaling oh my!
Kubernetes Horizontal Pod auto-scaling is the logical next step in ensuring your service has sufficient availability to meet demand that can fluctuate throughout the day.
Our own use-case involved a critical service that up until recently, had a fixed set of VM’s for each environment that were static and had no auto-scaling. This would now live as a Kubernetes deployment.
One of the key benefits that Kubernetes gives us is the ability to scale these pods on-demand. For us, auto-scaling according to the demand is an improvement that fits well with our Kubernetes stack and gives us a flexibility that we never had before. Also goes without saying the cost-savings that come out of smaller duplicate workloads that scale to demand.
HPA and custom metrics
HPA (Horizontal Pod Autoscaler) in Kubernetes out of the box supports only standard metrics that come from metrics server such as CPU and Memory metrics. While this would be fine for most cases where CPU or memory usage is correlated with demand, not all services are the same and some might require specific application specific metrics (or at least metrics not provided by the default metrics server).
Our kubernetes stack incorporates Prometheus for metrics and contains a fair amount of metrics that our developers have made available to scrape. So how can we make these metrics available to HPA?
prometheus-adapter is the answer.
The adapter hooks into the custom.metrics.k8s.io API to make metrics that you choose from Prometheus to be available to HPA. With this adapter we have the key to control HPA in ways that are specific to our service.
For example, let’s assume we have a service that keeps a constant WebSocket open with a client, and the sum of those connections per pod will determine whether we need more or less pods. Starting with a custom metric that is produced by our service and scraped by Prometheus called active_websocket_connections, here’s how we’d add it to the prometheus-adapter.
# --- SNIP ---
rules:
  default: false
  custom:
    - seriesQuery: 'active_websocket_connections{kubernetes_namespace!="",kubernetes_pod_name!=""}'
      resources:
        overrides:
          kubernetes_namespace:
            resource: namespace
          kubernetes_pod_name:
            resource: pod
      name:
        matches: "active_websocket_connections"
        as: "active_websocket_connections_sum"
      metricsQuery: sum by (<<.GroupBy>>) (<<.Series>>{<<.LabelMatchers>>})
# --- SNIP ---
We can create a rule in prometheus-adapter that will define some key configuration, but let’s break down the key parts:
- seriesQuery: What series in Prometheus to look for with labels.
active_websocket_connectionsis the metric name in Prometheus, and we’re retrieving the series that have non-null values forkubernetes_namespaceandkubernetes_pod_name.
- resources: What values to provide for the labels in the Prometheus query
- Here we’re informing prometheus-adapter, that the labels
kubernetes_namespaceandkubernetes_pod_namecorrespond to thenamespaceandpodAPI resource types in Kubernetes. As such when we query the metrics-server, these labels will be prefilled with the corresponding values depending on our request, in our case HPA will will be querying the metrics server about the pods in it’s target deployment.
- Here we’re informing prometheus-adapter, that the labels
- name: Name the metric, which would appear on the metrics server
- Now we have the opportunity to rename the metric to something more meaningful and related to the query we’ll perform. Our query is simply the sum of the active connections per pod, But we could be more creative with regex here if we wanted to.
- metricsQuery: The Prometheus query that will result in the value we’ll target for scaling
- Finally, this is the query against Prometheus that will return the values that would satisfy the metrics server. It includes templated variables specific to prometheus-adapter like
<<.GroupBy>>which will be the resource we’ll be querying, in our case HPA will be grouping bypod. It includes a template for<<.Series>>but we could have used the metric name directly here. Then finally,<<.labelMatchers>>, which will be thekubernetes_pod_nameandkubernetes_namespacelabels inserted.
- Finally, this is the query against Prometheus that will return the values that would satisfy the metrics server. It includes templated variables specific to prometheus-adapter like
It can be daunting to wrap your head around Prometheus queries, but it’s different again to convert that into a metricsQuery as it will include custom Golang template variables that is specific to the prometheus-adapter that’s denoted by the <<>> characters. You should look into the prometheus-adapter documentation for a better walk-through
At this point, once the prometheus-adapter config is applied, we should be able to query the metrics server for the current metric values for our pods and test our prometheus-adapter config.
kubectl get --raw "/apis/custom.metrics.k8s.io/v1beta1/namespaces/production_namespace/pods/*/active_websocket_connections_sum" | jq
{
  "kind": "MetricValueList",
  "apiVersion": "custom.metrics.k8s.io/v1beta1",
  "metadata": {},
  "items": [
    {
      "describedObject": {
        "kind": "Pod",
        "namespace": "production_namespace",
        "name": "super-cool-websocket-app-589bcfd659-jw9fs",
        "apiVersion": "/v1"
      },
      "metricName": "active_websocket_connections_sum",
      "timestamp": "2024-06-05T12:29:56Z",
      "value": "0",
      "selector": null
    },
    {
      "describedObject": {
        "kind": "Pod",
        "namespace": "production_namespace",
        "name": "super-cool-websocket-app-589bcfd659-p7n6d",
        "apiVersion": "/v1"
      },
      "metricName": "active_websocket_connections_sum",
      "timestamp": "2024-06-05T12:29:56Z",
      "value": "1",
      "selector": null
    },
  ]
}
Awesome! now we can see that our metrics server can indirectly query our Prometheus instance with the help of our defined prometheus-adapter rules. At this point we can rinse and repeat with different Prometheus metrics that we would want available in the Kubernetes metrics server.
Now onto the next step, to have HPA become aware of our new metric in the metrics server and to scale according to it.
---
kind: HorizontalPodAutoscaler
apiVersion: autoscaling/v2
metadata:
  name: super-cool-websocket-app-hpa
  namespace: production-namespace
spec:
  scaleTargetRef:
    apiVersion: apps/v1
    kind: Deployment
    name: super-cool-websocket-app-deployment
  minReplicas: 2
  maxReplicas: 10
  behaviour:
    scaleDown:
      policies:
      - periodSeconds: 300
        type: Pods
        value: 1
      selectPolicy: Min
      stabilizationWindowSeconds: 120
    scaleUp:
      policies:
      - periodSeconds: 60
        type: Pods
        value: 2
      - periodSeconds: 60
        type: Percent
        value: 50
      selectPolicy: Max
      stabilizationWindowSeconds: 0
  metrics:
  # use a "Pods" metric, which takes the average of the
  # given metric across all pods controlled by the autoscaling target
  - type: Pods
    pods:
      metric:
        name: active_websocket_connections_sum
      target:
        averageValue: "10"
        type: AverageValue
A quick breakdown of some key parts of this HPA resource config:
scaleTargetRefrefers to the object that will be scaled, in our case adeploymentresource that matches the name provided.minReplicas/maxreplicasdetermine the range that our HPA will scale from and to, depending on the metric that it uses for scaling.behaviourcontrols the maximum amount of pods the scale up and down operations can perform at once. It’s also important to notestabilizationWindowSeconds, as this determines how long the metric has to be in a scale up or down state before actually performing the scale operation. This is important to prevent HPA from “flapping” between different states too quickly.
Finally comes the part where we define the metric that HPA will use to determine when to scale our deployment. We first define the resource type the metric will query against, in our case, all the Pods in the scaleTargetRef.
It then takes the metric name we defined for the metrics server in the Prometheus-adapter config. For the target, we define the threshold that will be used to determine scaling and in this case it is the AverageValue of 10 across all pods in the scaleTargetRef resource.
With that, we have a basic HPA resource that can scale with our Prometheus metric.
$ kubectl -n production-namespace get hpa super-cool-websocket-app-hpa

NAME                                REFERENCE                                      TARGETS     MINPODS   MAXPODS   REPLICAS   AGE
super-cool-websocket-app-hpa   Deployment/super-cool-websocket-app-deployment       1/10          2         10        2        1d
Note: By default, the prometheus-adapter will update it’s cache of available metrics every 10 minutes. So it can take up to that amount of time before the metric will appear in the metrics server and thus available for your HPA resource.
You can refer to the Kubernetes docs for all the possible values in the HPA spec.
The ‘algorithm’
At this point we have a deployment that can scale according to the demand set by the metric we defined in Prometheus, but how does it determine when to scale?
desiredReplicas = ceil[currentReplicas * ( currentMetricValue / desiredMetricValue )]
Refer to the Kubernetes wiki for more info on the algorithm
The amount of pods that HPA determines the deployment should be set to is determined by a fairly simple algorithm. With the algorithm known, we can get some live context behind HPA’s scaling decisions.
We can even graph it alongside the other metrics produced by the HPA resource!
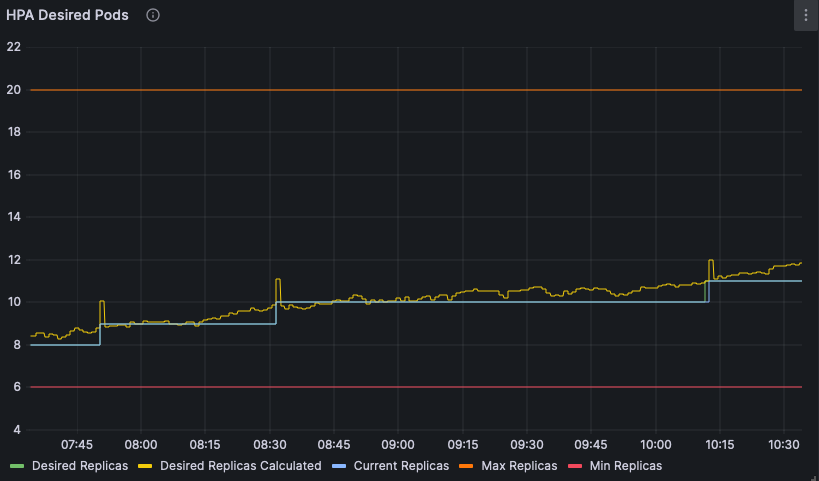
One thing that the algorithm doesn’t directly mention but is taken into account is the tolerance set for the cluster.
By default it is set to a value of 10% and configurable in the kube-controller-manager which will apply to all HPA resources in the cluster. This behaviour can be seen the graph above where there are multiple periods when our algorithm calculation determines that a new pod should exist but there appears to be a lag that can be accounted for with the tolerance value.
There is an open issue to make the tolerance controllable by the HPA resources themselves rather than cluster wide, but until there is a solution to that, the tolerance should be set to something sane for all your HPA resources in the cluster.
Preemptive scaling with HPA
Everything up to this point has worked and solves the issue of defining how available a service should be when demand changes throughout it’s life-cycle.
But consider that this is just a reactive way to scale. HPA will auto-scale to meet a demand that is already here, and your service can be caught unprepared if enough requests hit it at once.
Also consider the age of the metrics that HPA uses to auto-scale and how often it would retrieve them. For example:
- In our environment the service will update it’s metrics every minute.
- Prometheus will also scrape the service for metrics every minute.
- HPA scrapes the metrics server by default every fifteen seconds
At most, assuming that everything is not aligned, HPA can lag behind the current live value by up to two minutes and fifteen seconds. This can be considerable depending on the length of time a pod will take to scale up and provision a new pod and the stabilizationWindowSeconds value set on scale up.
But what if we know the peak times that our service would receive the most demand and can prepare our service for it?
Unfortunately there isn’t an in-built way in HPA to support this, and there have been a few issues that discuss it here and here with various solutions or workarounds.
By patching the minReplicas field within our HPA spec live in the cluster, we can simulate the ideal behaviour we want. Adjust it up to prepare for peak hours, lower it during off-peak and let HPA scale down naturally with the lowered demand.
# Scale up before peak
kubectl patch hpa super-cool-websocket-app-hpa -p '{"spec":{"minReplicas": 5}}'

# Scale down during off-peak
kubectl patch hpa super-cool-websocket-app-hpa -p '{"spec":{"minReplicas": 2}}'
HPA will automatically adjust to this value, up-scaling to ensure the minimum amount of replicas are reached and also scaling above this value when our metrics determine that to be the case.
Now to achieve this automatically, we’re going to need something a bit more sophisticated.
Introducing hpa-time-scaler!
It essentially does what can be done manually, but with some nice config wrapped around it, with the intention for it to be run as a cronjob.
This cronjob would be bundled with your application along with your HPA resource, and bump the minReplicas field according to the config you set for it.
Let’s see what an example cronjob with hpa-time-scaler looks like:
apiVersion: v1
kind: ConfigMap
metadata:
  name: super-cool-websocket-app-time-scaler-cron
data:
  # -----------------------------------------------------------------------------------------------
  # HPA TIME SCALER CONFIG
  # -----------------------------------------------------------------------------------------------
  SCALE_UP_TIME: "08:00"
  SCALE_DOWN_TIME: "13:30"
  TIMEZONE: "Australia/Melbourne"
  SCALE_UP_REPLICAS: "5"
  SCALE_DOWN_REPLICAS: "2"
  HPA_NAME: "super-cool-websocket-app-hpa"
---
apiVersion: batch/v1
kind: CronJob
metadata:
  name: super-cool-websocket-app-time-scaler-cron
  labels:
    app: super-cool-websocket-app-time-scaler-cron
spec:
  successfulJobsHistoryLimit: 1
  schedule: "1,31 * * * 1-5"
  timeZone: "Australia/Melbourne"
  concurrencyPolicy: Forbid
  jobTemplate:
    spec:
      template:
        metadata:
          name: super-cool-websocket-app-cron
          labels:
            app: super-cool-websocket-app-time-scaler-cron
        spec:
          serviceAccountName: hpa-time-scaler-sa
          containers:
            - name: super-cool-websocket-app-cron
              image: ghcr.io/reecetech/hpa-time-scaler:1.0.0
              imagePullPolicy: IfNotPresent
              tty: true
              env:
                - name: NAMESPACE
                  valueFrom:
                    fieldRef:
                      fieldPath: metadata.namespace
              envFrom:
                - configMapRef:
                    name: super-cool-websocket-app-time-scaler-cron
          restartPolicy: OnFailure
Note: Be careful what you name and label your cronjob pods. If they match the selector defined in the deployment that your scaling, then HPA will include that pod in it’s scaling decisions and possibly under-provision your service!
We also need to ensure that the cronjob service account has the API permissions to patch the HPA object, as well as the ability to create events notifying the environment that the hpa-time-scaler has modified the HPA object.
apiVersion: rbac.authorization.k8s.io/v1
kind: RoleBinding
metadata:
  name: hpa-time-scaler_rolebinding
roleRef:
  apiGroup: rbac.authorization.k8s.io
  kind: Role
  name: hpa-time-scaler_role
subjects:
# Add all the ServiceAccounts that need to be bound to this Role
- kind: ServiceAccount
  name: hpa-time-scaler-sa

---
apiVersion: rbac.authorization.k8s.io/v1
kind: Role
metadata:
  name: hpa-time-scaler_role
rules:
- apiGroups:
  - autoscaling/v2
  - autoscaling
  resources:
  - horizontalpodautoscalers
  resourcenames:
  - super-cool-websocket-app-hpa
  verbs:
  - get
  - list
  - patch
  - update
- apiGroups:
  - events.k8s.io
  resources:
  - events
  verbs:
  - create
We’ve scoped the role down to the specific HPA resource that we want to modify and the rolebinding accepts our service account for our cronjob as a subject to assume the role.
With that basic cronjob setup, we have a config for the hpa-time-scaler that will set a minReplica count of 5 pods at 8AM AEST and then reduce the minimum to 2 pods at 1PM AEST. This will be non-impacting to the regular scaling that HPA performs, as we’re only raising the lower bound that HPA will start scaling from.
The cronjob runs twice an hour for all weekdays and skipping the weekend to match our business requirements of only scaling up to meet demand.
As a result, we now have a service that can scale according to a metric that it produces to react to the demand that inevitably happens throughout the day. We also have a cronjob bundled with our service deployment that will increase and decrease the minimum availability at set times to prepare for the common peak times that happen during the service’s lifetime.
And that’s auto-scaling folks…